

PL-300 sample exam questions
15 exam-style questions for Microsoft PL-300: Power BI Data Analyst, with answers and explanations. Take them as a timed practice exam first if you want a score out of 1000.
- A business intelligence (BI) developer creates a dataflow in Power BI that uses DirectQuery to access tables from an on-premises Microsoft SQL server. The
Enhanced Dataflows Compute Engine is turned on for the dataflow.
You need to use the dataflow in a report. The solution must meet the following requirements:
✑ Minimize online processing operations.
✑ Minimize calculation times and render times for visuals.
✑ Include data from the current year, up to and including the previous day.
What should you do?- ACreate a dataflows connection that has DirectQuery mode selected.
- BCreate a dataflows connection that has DirectQuery mode selected and configure a gateway connection for the dataset.
- CCreate a dataflows connection that has Import mode selected and schedule a daily refresh.
- DCreate a dataflows connection that has Import mode selected and create a Microsoft Power Automate solution to refresh the data hourly.
Show answer
Correct answer: C
WhyImporting the dataflow data and scheduling a daily refresh gives fast, in-memory visuals and data up to the previous day with minimal online processing. DirectQuery against the dataflow would push queries to the compute engine every time someone uses a visual, and hourly refreshes through Power Automate add unnecessary processing.
- A
- DRAG DROP
You use Power Query Editor to preview the data shown in the following exhibit.
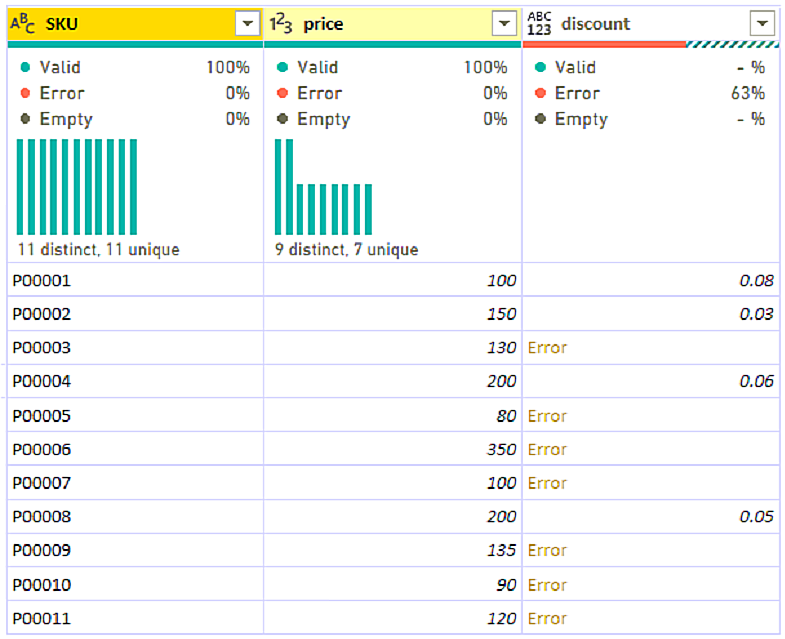
You need to clean and transform the query so that all the rows of data are maintained, and error values in the discount column are replaced with a discount of 0.05. The solution must minimize administrative effort.
Which three actions should you perform in sequence? To answer, move the appropriate actions from the list of actions to the answer area and arrange them in the correct order.
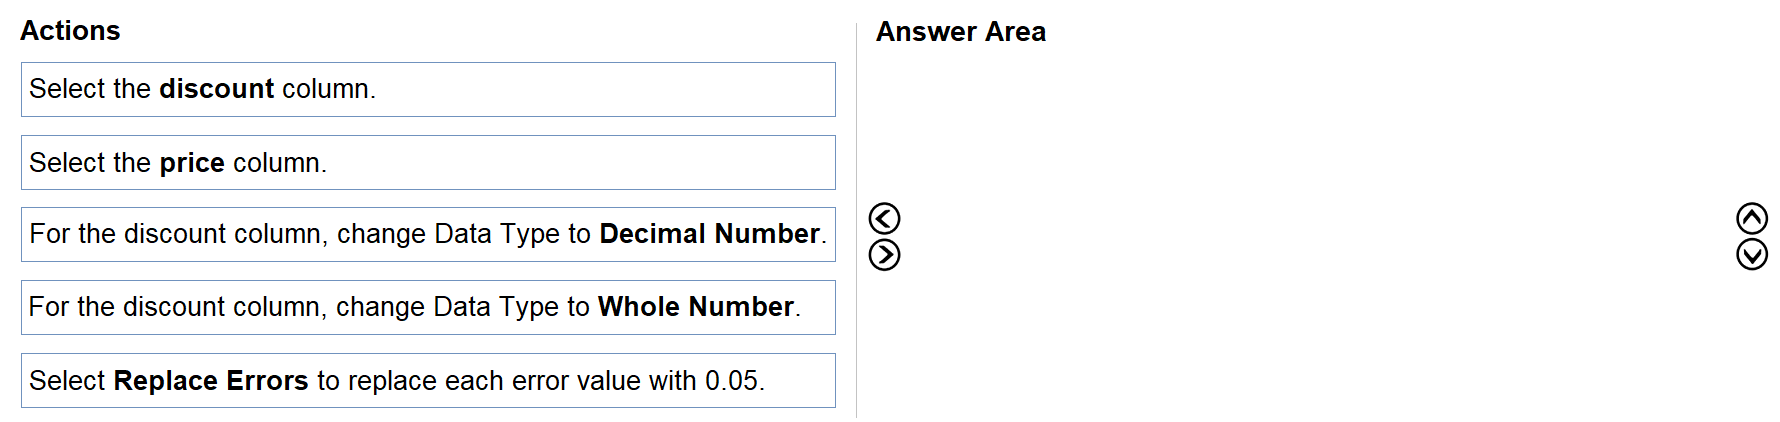
Arrange 3 of these in the correct order:
- Select the discount column.
- Select the price column.
- For the discount column, change Data Type to Decimal Number.
- For the discount column, change Data Type to Whole Number.
- Select Replace Errors to replace each error value with 0.05.
Show answer
- Select the discount column.
- For the discount column, change Data Type to Decimal Number.
- Select Replace Errors to replace each error value with 0.05.
WhySelect the discount column and set its type to Decimal Number, because Whole Number would round values such as 0.08 to 0. Then use Replace Errors to put 0.05 in place of the errors. This keeps every row, while Remove Errors would delete rows.
- You are reviewing a Power BI data model.
You have a calculated table that has the following definition.
ProductList = INTERSECT ( ProductsGroupA, ProductsGroupB )
You need to identify the results of the DAX expression.
Which rows will be returned in ProductList?- Aall the rows in ProductsGroupB that have a matching row in ProductsGroupA
- Ball the rows in both tables
- Call the rows in ProductsGroupA that have a matching row in ProductsGroupB
- Dall the rows in ProductsGroupA that have no matching row in ProductsGroupB.
Show answer
Correct answer: C
WhyINTERSECT(ProductsGroupA, ProductsGroupB) returns the rows of the first table (A) that also appear in the second table (B), keeping duplicates from A. EXCEPT would return the rows of A with no match in B, and UNION would return all rows from both.
- A
- HOTSPOT
You have a Power BI report with the Edit relationship page open as shown in the following exhibit.
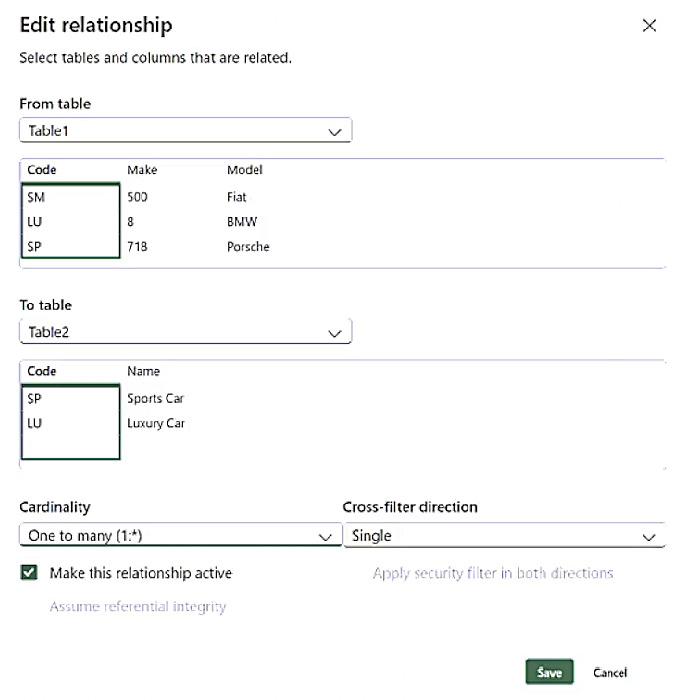
Use the drop-down menus to select the answer choice that completes each statement based on the information presented in the graphic.
NOTE: Each correct selection is worth one point.
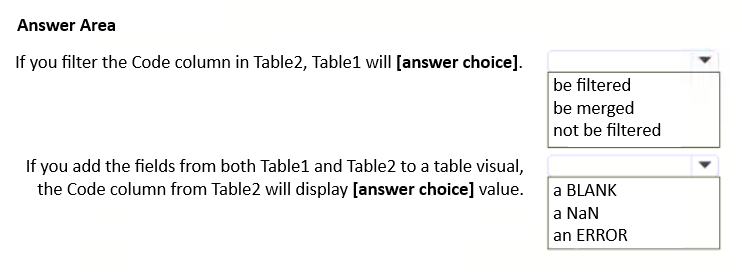
If you filter the Code column in Table2, Table1 will [answer choice]. be filtered / be merged / not be filtered If you add the fields from both Table1 and Table2 to a table visual, the Code column from Table2 will display [answer choice] value. a BLANK / a NaN / an ERROR Show answer
- If you filter the Code column in Table2, Table1 will [answer choice]. not be filtered
- If you add the fields from both Table1 and Table2 to a table visual, the Code column from Table2 will display [answer choice] value. a BLANK
WhyThe relationship is one-to-many from Table1 to Table2 with single cross-filter direction, so filters flow only from Table1 to Table2. Table1 code SM has no matching row in Table2, so Table2's Code shows a blank for it.
- DRAG DROP
You have a Power BI report that contains three pages. The pages are used to analyze sales across various countries.
You add a slicer named Country to each page of the report.
You need to configure the report to meet the following requirements:
• When a user selects a country on the first page, the report must filter the other pages.
• The second and third pages must display only the filtered results.
Which task should you perform for each requirement? To answer, drag the appropriate task to the correct requirement. Each task may be used once, more than once, or not at all. You may need to drag the split bar between panes or scroll to view content.
NOTE: Each correct selection is worth one point.
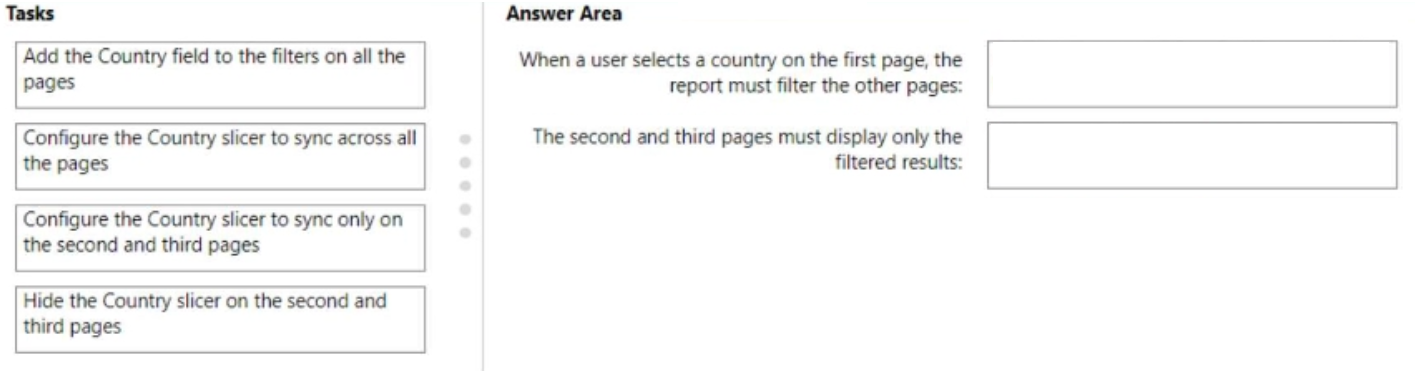
Move each item to the matching row:
- Add the Country field to the filters on all the pages
- Configure the Country slicer to sync across all the pages
- Configure the Country slicer to sync only on the second and third pages
- Hide the Country slicer on the second and third pages
- When a user selects a country on the first page, the report must filter the other pages:
- The second and third pages must display only the filtered results:
Show answer
- When a user selects a country on the first page, the report must filter the other pages: Configure the Country slicer to sync across all the pages
- The second and third pages must display only the filtered results: Hide the Country slicer on the second and third pages
WhySync slicers carries the first page's selection to every page. Hiding the slicer on pages two and three, while keeping it synced, means those pages still apply the filter but users there see only the results and cannot change the selection.
- You have a Power BI report that will be rendered on a vertical display.
You need to maximize the portion of the screen area used by the report.
What should you do?- AFrom the Canvas background setting of Power BI Desktop, configure the Image fit setting.
- BFrom the Canvas settings of Power BI Desktop, set a custom width and height.
- CFrom Power BI Desktop, select Personalize visuals.
- DFrom the Power BI service, enable the Pages pane.
Show answer
Correct answer: B
WhyIn Power BI Desktop's Canvas settings, choose a custom page size with a width and height that match the portrait display, so the report fills the screen. Background image fit only stretches the image, Personalize visuals is for readers, and the Pages pane takes up space.
- A
- From Power BI Desktop, you publish a new dataset and report to a Power BI workspace. The dataset has a row-level security (RLS) role named HR.
You need to ensure that the HR team members have RLS applied when they view reports based on the dataset.
What should you do?- AFrom powerbi.com, add users to the HR role for the dataset.
- BFrom powerbi.com, share the dataset to the HR team members.
- CFrom Power BI Desktop, change the Row-Level Security settings.
- DFrom Power BI Desktop, import a table that contains the HR team members.
Show answer
Correct answer: A
WhyRLS roles are defined in Power BI Desktop, but membership is assigned after publishing. In the Power BI service, open the semantic model's Security settings and add the HR team (preferably a security group) to the HR role. Sharing the dataset alone does not map users to the role.
- A
- HOTSPOT
You have two Power BI workspaces named WorkspaceA and WorkspaceB. WorkspaceA contains two datasets named Sales and HR.
You need to provide a user named User1 with access to the WorkspaceB. The solution must meet the following requirements:
• Create reports that use the HR dataset.
• Publish the reports to WorkspaceB.
• Prevent the ability to modify the HR dataset.
• Prevent the ability to add users to Workspaces.
What should you do? To answer, select the appropriate options in the answer area.
NOTE: Each correct selection is worth one point.
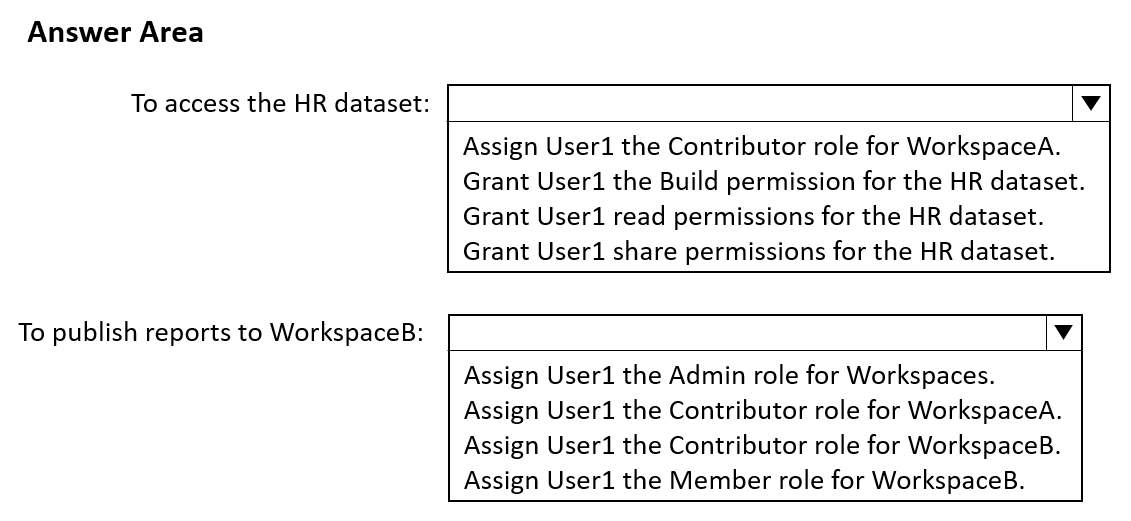
To access the HR dataset: Assign User1 the Contributor role for WorkspaceA. / Grant User1 the Build permission for the HR dataset. / Grant User1 read permissions for the HR dataset. / Grant User1 share permissions for the HR dataset. To publish reports to WorkspaceB: Assign User1 the Admin role for Workspaces. / Assign User1 the Contributor role for WorkspaceA. / Assign User1 the Contributor role for WorkspaceB. / Assign User1 the Member role for WorkspaceB. Show answer
- To access the HR dataset: Grant User1 the Build permission for the HR dataset.
- To publish reports to WorkspaceB: Assign User1 the Contributor role for WorkspaceB.
WhyBuild permission lets User1 create reports from the HR dataset without being able to modify it, whereas a WorkspaceA Contributor could edit it. Contributor on WorkspaceB allows publishing reports there but not adding users, which Member and Admin can do.
- You create a Power BI workspace named Workspace1.
You publish a semantic model and a report to Workspace1.
You need to configure Workspace1 to meet the following requirements:
• Provide access to a group named Sales.
• Ensure that Sales can invite other users to Workspace1.
• Follow the principle of least privilege.
Which role should you assign to Sales?- AContributor
- BMember
- CAdmin
- DViewer
Show answer
Correct answer: B
WhyThe case requires near-real-time data from the on-premises SQL Server, so DirectQuery through the on-premises data gateway is needed. The gateway data source uses a stored database credential. Import would show stale data, and passing end-user credentials (SSO) is not required by the scenario.
- A
- DRAG DROP
You have a Power BI semantic model.
You need to configure row-level security (RLS) to restrict data access for users that have the Viewer permissions.
Which three actions should you perform in sequence? To answer, move the appropriate actions from the list of actions to the answer area and arrange them in the correct order.

Arrange 3 of these in the correct order:
- Assign the users the Contributor role for the Power BI workspace.
- Publish the semantic model.
- Assign the users the Member role for the Power BI workspace.
- From the Power BI service, assign the new RLS role to the users.
- From Microsoft Power BI Desktop, create a new RLS role by using a DAX filter.
Show answer
- From Microsoft Power BI Desktop, create a new RLS role by using a DAX filter.
- Publish the semantic model.
- From the Power BI service, assign the new RLS role to the users.
WhyRLS roles and their DAX filters are defined in Power BI Desktop, then published with the model. Members are assigned to roles in the service. RLS applies only to Viewers, so giving users Contributor or Member would bypass it because those roles have Write permission.
- You need to configure access for the sales department users. The solution must the meet the security requirements.
What should you do?- AShare each report to the Azure Active Directory group of the sales department.
- BAdd the Azure Active Directory group of the sales department as an Admin of the reports workspace.
- CDistribute an app to the users in the Azure Active Directory group of the sales department.
- DAdd the sales department as a member of the reports workspace.
Show answer
Correct answer: D
WhyThe community chose app distribution, but an app grants only read access. The sales department must create, edit and delete content, manage permissions, publish and unpublish the app, and assign groups to workspace roles. Microsoft lists exactly these as Member role capabilities, so the least-privilege fit is Member, not Admin.
- A
- Which DAX expression should you use to get the ending balances in the balance sheet reports?
- ACALCULATE ( SUM( BalanceSheet[BalanceAmount] ), LASTDATE ( 'Date'[Date] ) )
- BCALCULATE ( SUM( BalanceSheet[BalanceAmount] ), DATESQTD('Date'[Date]) )
- CFIRSTNONBLANK ('Date'[Date] SUM( BalanceSheet[BalanceAmount] ) )
- DCALCULATE ( MAX( BalanceSheet[BalanceAmount] ), LASTDATE ('Date'[Date] ))
Show answer
Correct answer: A
WhyBalance sheet amounts are semi-additive snapshots, so the ending balance is the balance on the last date of the selected period. CALCULATE(SUM(BalanceSheet[BalanceAmount]), LASTDATE('Date'[Date])) returns it. DATESQTD would add up balances across the quarter, MAX returns the largest single row, and FIRSTNONBLANK returns a date rather than the ending balance.
- A
- You merge data from Sales_Region, Region_Manager, Sales_Manager, and Manager into a single table named Region.
What should you do next to meet the reporting requirements of the executives?- ACreate a DAX calculated column that retrieves the region manager from the Weekly_Returns table based on the sales_region_id column.
- BApply row-level security (RLS) to the Region table based on the sales manager username.
- CConfigure a bi-directional relationship between Region and Sales_Region.
- DIn the Region table, create a hierarchy that has the manager name, and then the sales manager name.
Show answer
Correct answer: D
WhyAfter merging the manager tables into Region, creating a hierarchy (region manager name, then sales manager name) lets executives drill from region managers down to sales managers, as their reporting requirements ask. RLS, bidirectional relationships and a lookup column do not provide the drill-down.
- A
- You need to create the On-Time Shipping report. The report must include a visualization that shows the percentage of late orders.
Which type of visualization should you create?- Apie chart
- Bscatterplot
- Cbar chart
Show answer
Correct answer: C
WhyThe percentage of late orders has to be compared across many countries and shipping regions, which a bar chart shows clearly. A pie chart only works for a few parts of a whole and cannot show the percentage per country well, and a scatterplot compares two numeric measures.
- A
- What is the minimum number of Power BI datasets needed to support the reports?
- Aa single imported dataset
- Btwo imported datasets
- Ctwo DirectQuery datasets
- Da single DirectQuery dataset
Show answer
Correct answer: B
WhyThe scenario's reports draw on data with different security and refresh requirements that cannot share one model. Two imported semantic models (datasets) is the minimum that supports all the reports. DirectQuery is not needed for the required data freshness and would slow the reports.
- A